 NORTIVO
2026 trading performance report
January 2, 2026 – November 17, 2026
A closer reading of the supplied account history: results, the path between them, and the definitions behind the figures.
Open the supplied PDFReported over the full period, against opening account equity of NOK 250,000.
Reported historical results. Future returns may differ. The supplied material does not establish independent audit or confirm execution status.
Reported trading results
Read the account result and its drawdown together. The session averages below use different capital bases and describe different things.
- Return on opening equity
- +58.22%
- Maximum drawdown
- −26.65%
- Closing account equity
- NOK 395,538.19
- Average session return on deployed capital
- +2.40%
- Average session return on account equity
- +0.2256%
- Trading sessions
- 222
- Reported trades
- 1,152
The 2.40% average uses capital deployed during each session. The full account averaged 0.2256% per session. These are separate measures, not interchangeable daily returns. Read the definitions.
The path through the period
All 222 reported session closing values remain in the curve, including the early-year decline and later recovery.
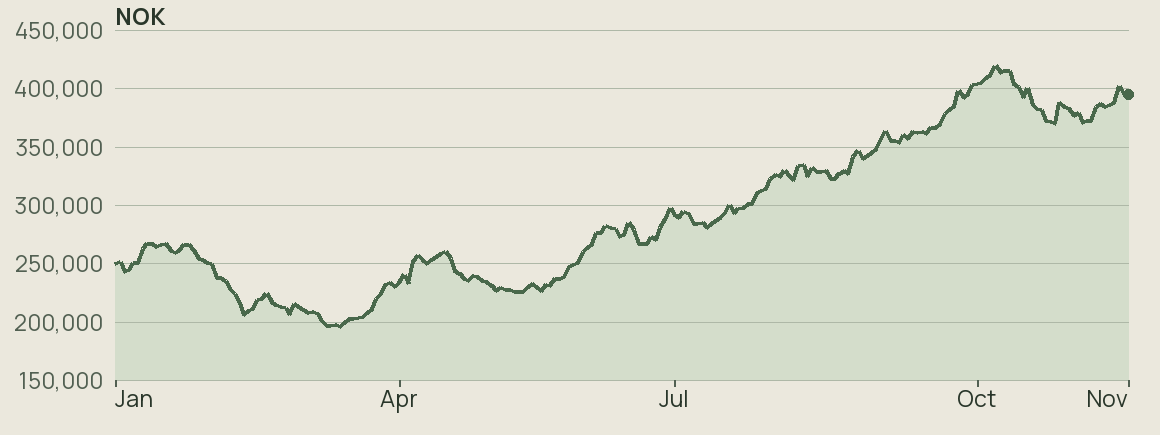
Drag or use the arrow keys to inspect each reported closing value.
The chart uses reported session closing equity. It does not show intraday movement. On a small screen, scroll the chart horizontally or open the complete data view below.
Read all 222 session closing values
| Trading session | Date | Closing equity |
|---|---|---|
| 1 | NOK 250,257.68 | |
| 2 | NOK 252,287.30 | |
| 3 | NOK 243,737.53 | |
| 4 | NOK 244,872.24 | |
| 5 | NOK 250,854.56 | |
| 6 | NOK 250,886.03 | |
| 7 | NOK 263,249.45 | |
| 8 | NOK 267,351.40 | |
| 9 | NOK 267,146.48 | |
| 10 | NOK 264,589.30 | |
| 11 | NOK 266,727.71 | |
| 12 | NOK 267,136.55 | |
| 13 | NOK 261,101.46 | |
| 14 | NOK 259,949.21 | |
| 15 | NOK 261,821.32 | |
| 16 | NOK 266,517.39 | |
| 17 | NOK 266,338.73 | |
| 18 | NOK 261,292.53 | |
| 19 | NOK 254,188.42 | |
| 20 | NOK 253,423.29 | |
| 21 | NOK 251,216.16 | |
| 22 | NOK 250,217.52 | |
| 23 | NOK 238,614.69 | |
| 24 | NOK 238,466.36 | |
| 25 | NOK 235,469.22 | |
| 26 | NOK 228,268.98 | |
| 27 | NOK 224,826.55 | |
| 28 | NOK 217,269.75 | |
| 29 | NOK 206,388.79 | |
| 30 | NOK 210,162.52 | |
| 31 | NOK 211,987.41 | |
| 32 | NOK 219,028.21 | |
| 33 | NOK 220,676.49 | |
| 34 | NOK 224,148.56 | |
| 35 | NOK 217,790.61 | |
| 36 | NOK 215,274.60 | |
| 37 | NOK 213,202.93 | |
| 38 | NOK 212,415.13 | |
| 39 | NOK 206,394.59 | |
| 40 | NOK 216,216.42 | |
| 41 | NOK 213,677.07 | |
| 42 | NOK 211,220.02 | |
| 43 | NOK 208,688.10 | |
| 44 | NOK 208,788.96 | |
| 45 | NOK 207,189.21 | |
| 46 | NOK 201,059.05 | |
| 47 | NOK 196,783.95 | |
| 48 | NOK 196,893.28 | |
| 49 | NOK 197,997.20 | |
| 50 | NOK 196,104.55 | |
| 51 | NOK 199,918.25 | |
| 52 | NOK 202,878.92 | |
| 53 | NOK 202,830.72 | |
| 54 | NOK 203,760.59 | |
| 55 | NOK 204,439.63 | |
| 56 | NOK 208,096.71 | |
| 57 | NOK 211,381.37 | |
| 58 | NOK 219,976.63 | |
| 59 | NOK 224,816.48 | |
| 60 | NOK 232,112.67 | |
| 61 | NOK 234,263.85 | |
| 62 | NOK 230,568.94 | |
| 63 | NOK 233,576.04 | |
| 64 | NOK 240,681.02 | |
| 65 | NOK 233,429.26 | |
| 66 | NOK 252,019.55 | |
| 67 | NOK 256,936.93 | |
| 68 | NOK 253,332.62 | |
| 69 | NOK 249,881.16 | |
| 70 | NOK 253,657.74 | |
| 71 | NOK 256,552.87 | |
| 72 | NOK 258,949.83 | |
| 73 | NOK 260,395.77 | |
| 74 | NOK 254,827.00 | |
| 75 | NOK 243,968.31 | |
| 76 | NOK 241,675.49 | |
| 77 | NOK 237,400.81 | |
| 78 | NOK 235,659.16 | |
| 79 | NOK 240,309.52 | |
| 80 | NOK 238,819.45 | |
| 81 | NOK 235,544.22 | |
| 82 | NOK 234,490.32 | |
| 83 | NOK 231,405.74 | |
| 84 | NOK 226,768.50 | |
| 85 | NOK 229,574.50 | |
| 86 | NOK 227,870.67 | |
| 87 | NOK 227,644.36 | |
| 88 | NOK 226,507.16 | |
| 89 | NOK 226,494.00 | |
| 90 | NOK 226,627.29 | |
| 91 | NOK 230,733.51 | |
| 92 | NOK 232,892.19 | |
| 93 | NOK 229,931.69 | |
| 94 | NOK 226,358.95 | |
| 95 | NOK 231,924.80 | |
| 96 | NOK 231,321.56 | |
| 97 | NOK 237,060.24 | |
| 98 | NOK 237,052.17 | |
| 99 | NOK 238,908.07 | |
| 100 | NOK 247,933.29 | |
| 101 | NOK 249,781.69 | |
| 102 | NOK 250,886.70 | |
| 103 | NOK 260,411.12 | |
| 104 | NOK 263,600.93 | |
| 105 | NOK 267,422.10 | |
| 106 | NOK 277,066.34 | |
| 107 | NOK 277,176.13 | |
| 108 | NOK 282,497.25 | |
| 109 | NOK 281,467.02 | |
| 110 | NOK 280,410.18 | |
| 111 | NOK 273,323.33 | |
| 112 | NOK 275,423.58 | |
| 113 | NOK 285,856.96 | |
| 114 | NOK 279,322.40 | |
| 115 | NOK 267,743.30 | |
| 116 | NOK 267,833.87 | |
| 117 | NOK 267,650.72 | |
| 118 | NOK 273,202.56 | |
| 119 | NOK 270,687.05 | |
| 120 | NOK 281,001.07 | |
| 121 | NOK 287,649.00 | |
| 122 | NOK 298,031.41 | |
| 123 | NOK 292,259.30 | |
| 124 | NOK 290,043.06 | |
| 125 | NOK 294,434.88 | |
| 126 | NOK 293,150.78 | |
| 127 | NOK 284,201.55 | |
| 128 | NOK 284,592.09 | |
| 129 | NOK 285,438.17 | |
| 130 | NOK 281,436.26 | |
| 131 | NOK 284,855.13 | |
| 132 | NOK 286,830.07 | |
| 133 | NOK 290,026.79 | |
| 134 | NOK 293,712.78 | |
| 135 | NOK 300,476.71 | |
| 136 | NOK 293,294.35 | |
| 137 | NOK 297,486.09 | |
| 138 | NOK 298,179.86 | |
| 139 | NOK 301,464.67 | |
| 140 | NOK 301,484.46 | |
| 141 | NOK 311,305.41 | |
| 142 | NOK 312,608.64 | |
| 143 | NOK 314,476.88 | |
| 144 | NOK 323,523.02 | |
| 145 | NOK 326,941.00 | |
| 146 | NOK 324,441.51 | |
| 147 | NOK 330,148.24 | |
| 148 | NOK 325,079.71 | |
| 149 | NOK 321,356.95 | |
| 150 | NOK 333,944.95 | |
| 151 | NOK 335,016.47 | |
| 152 | NOK 324,692.65 | |
| 153 | NOK 332,337.66 | |
| 154 | NOK 328,769.23 | |
| 155 | NOK 329,533.02 | |
| 156 | NOK 329,929.36 | |
| 157 | NOK 323,401.63 | |
| 158 | NOK 322,849.54 | |
| 159 | NOK 327,605.75 | |
| 160 | NOK 330,109.12 | |
| 161 | NOK 327,022.58 | |
| 162 | NOK 342,077.65 | |
| 163 | NOK 346,902.19 | |
| 164 | NOK 339,876.02 | |
| 165 | NOK 342,966.39 | |
| 166 | NOK 345,809.26 | |
| 167 | NOK 348,676.55 | |
| 168 | NOK 355,320.97 | |
| 169 | NOK 364,210.49 | |
| 170 | NOK 355,759.69 | |
| 171 | NOK 355,365.57 | |
| 172 | NOK 354,213.30 | |
| 173 | NOK 360,817.40 | |
| 174 | NOK 357,103.73 | |
| 175 | NOK 363,687.66 | |
| 176 | NOK 362,344.38 | |
| 177 | NOK 363,570.77 | |
| 178 | NOK 361,593.86 | |
| 179 | NOK 366,430.51 | |
| 180 | NOK 367,239.23 | |
| 181 | NOK 370,327.36 | |
| 182 | NOK 379,058.22 | |
| 183 | NOK 382,434.47 | |
| 184 | NOK 386,059.67 | |
| 185 | NOK 398,733.31 | |
| 186 | NOK 392,920.56 | |
| 187 | NOK 395,792.05 | |
| 188 | NOK 403,329.00 | |
| 189 | NOK 404,759.82 | |
| 190 | NOK 405,279.51 | |
| 191 | NOK 410,075.69 | |
| 192 | NOK 412,349.58 | |
| 193 | NOK 420,135.62 | |
| 194 | NOK 414,031.57 | |
| 195 | NOK 415,324.09 | |
| 196 | NOK 415,449.80 | |
| 197 | NOK 404,353.54 | |
| 198 | NOK 402,144.16 | |
| 199 | NOK 392,709.43 | |
| 200 | NOK 401,185.66 | |
| 201 | NOK 386,290.68 | |
| 202 | NOK 383,002.57 | |
| 203 | NOK 382,341.90 | |
| 204 | NOK 372,682.45 | |
| 205 | NOK 371,863.87 | |
| 206 | NOK 370,559.29 | |
| 207 | NOK 388,103.57 | |
| 208 | NOK 385,137.53 | |
| 209 | NOK 382,866.84 | |
| 210 | NOK 377,339.68 | |
| 211 | NOK 379,591.12 | |
| 212 | NOK 371,309.30 | |
| 213 | NOK 373,019.51 | |
| 214 | NOK 372,663.78 | |
| 215 | NOK 384,457.46 | |
| 216 | NOK 387,156.86 | |
| 217 | NOK 384,575.29 | |
| 218 | NOK 386,432.28 | |
| 219 | NOK 388,108.74 | |
| 220 | NOK 402,700.83 | |
| 221 | NOK 395,964.28 | |
| 222 | NOK 395,538.19 |
Month by month
February and October recorded losses. The positive year-to-date result includes both of those months; November covers only the first 12 reported sessions.
| Month | Sessions | Trading P&L | Return |
|---|---|---|---|
| Jan 2026 | 20 | NOK 3,423.29 | +1.37% |
| Feb 2026 | 20 | -NOK 37,206.87 | -14.68% |
| Mar 2026 | 22 | NOK 14,352.52 | +6.64% |
| Apr 2026 | 20 | NOK 3,921.38 | +1.70% |
| May 2026 | 19 | NOK 15,291.38 | +6.52% |
| Jun 2026 | 21 | NOK 48,249.72 | +19.32% |
| Jul 2026 | 23 | NOK 28,909.58 | +9.70% |
| Aug 2026 | 21 | NOK 18,868.26 | +5.77% |
| Sep 2026 | 22 | NOK 57,519.74 | +16.63% |
| Oct 2026 | 22 | -NOK 25,989.32 | -6.44% |
| Nov 2026 | 12 | NOK 18,198.51 | +4.82% |
The existing May and July P&L figures each differ by NOK 0.01 from changes between the source series closing values. The differences offset over the full period; both original monthly figures are retained here.
Read return alongside risk
The final balance does not describe every experience within the period. Closing-equity drawdown and the treatment of costs provide essential context.
A closing-equity measure
The supplied report measures maximum drawdown from a prior closing-equity peak to a subsequent trough. It records the deepest trough on March 13, 2026. Its method makes no allowance for intraday excursions, so this figure does not describe the largest possible intraday loss.
What the material establishes
This page presents the supplied report and its historical equity series. It does not establish an independently audited account, current live performance, or a link between this history and the separate trading demonstrations. The original PDF remains available for inspection.
Definitions, costs & sources
The capital base matters. The source report distinguishes deployed capital from account equity and includes a modelled slippage allowance in costs.
- Return on opening equity
- Trading profit for the period divided by opening account equity of NOK 250,000. The opening value, closing value and period profit reconcile in the canonical summary.
- Session return on deployed capital
- The source defines this as session net profit divided by the notional capital put to work during that session. It is not the return on the full account.
- Session return on account equity
- The source compounds session profit against the prior closing account equity. The reported average is shown separately from the deployed-capital average.
- Costs deducted at source
- The PDF states that trading costs include commission per side lot, exchange and clearing fees, and a modelled slippage allowance of 1.10 basis points of notional. Modelled slippage is an assumption, not an observed execution charge.
Reported transaction costs
| Cost component | Reported amount |
|---|---|
| Commissions | NOK 27,648 |
| Exchange and clearing fees | NOK 150 |
| Modelled slippage | NOK 822 |
| Total trading cost | NOK 28,620 |
Inspect the source material
Headline figures follow the canonical report summary. The chart and complete data view use the retained 222-session equity series. The monthly trading P&L table preserves its existing figures. Definitions and cost totals above are attributed to the supplied PDF, particularly page 3.